
Before AI Can Optimize Your Fruit Sorter, You Need to Know What’s Really Happening
About a year ago, I wrote an article called “Is Your Fruit Sorter Hitting Its True Potential? How to Quickly Assess Your Operation.”
Is Your Fruit Sorter Hitting Its True Potential? How to Quickly Assess Your Operation — OPTI-FRESH
At the time, I was trying to get an idea out of my head and onto paper. The question I was working through was:
How do you know if your fruit sorter is actually performing as well as it could be?
Looking back now, I can see that article was not a one-off thought, it’s probably encompassing the purpose OPTI-FRESH has adopted and steers the work I’ve been doing with my clients the last 12 months.
Over the last year, I’ve realized a lot of what I do intuitively when assessing fruit sorting operations is actually a repeatable way of thinking. It is a combination of operational experience, machine understanding, data interpretation, real world validation, and pattern recognition.
For a long time, those thought processes have lived in my own head.
The future of OPTI-FRESH is about turning those systems into something more accessible - practical tools, methods, and service products that help fruit and vegetable operations make better decisions around their automated sorting equipment.
Because as more data becomes available to packhouses, the next challenge will not simply be collecting information.
The next challenge will be knowing what to do with it.
More Data Is Good - But Data Alone Is Not the Full Answer
Over the past year, I have seen more machine data and operational reporting becoming available to customer. That is a positive step.
It gives me confidence that the industry is moving toward a broader understanding that data is not just a “nice to have”. It is an essential foundation for better decision-making today, and for AI-supported operations in the near future.
But there is an important distinction to make.
Having access to data does not automatically mean you have useful insight.
A dashboard can tell you what happened.
A report can show you a trend.
A machine can produce numbers all day.
But unless those numbers are connected to real-world evidence of operating conditions, they can easily create false confidence.
And in some cases, they can reinforce the assumptions you already had.
That is where the real work starts.
Level One: Building a Measurement Foundation
Before an operation can make better decisions, it needs to understand what it is actually measuring.
This sounds simple, but in practice it is often wher ethe biggest gaps are.
Questions like these matter:
Are the machine numbers accurate?
Are the packout figures being compared against the right input volume?
Are the reject %’s being checked by looking at actual fruit?
Are the reported defects matching what is physically being seen on the line?
Are the settings, market requirements, crop condition, and operator decisions being recorded alongside the results?
Without this foundation, reports and dashboards can becaome polished version of incomplete information.
So in my view, the first step is not advanced AI. The first step is trust,
Trust that the data is accurate enough to use.
Trust that it reflects what happened in the real world.
Trust that the operation is comparing the right numbers against the right outcomes.
This measurement layer isn’t glamorous, but it is essential as its the base everything else is built on.
Level Two: Descriptive Data - What Happended?
Once the measurement foundation exists, the next layer is descriptive reporting.
This is where many operations are starting to improve.
Descriptive data answers questions like:
What volume was processed?
What was the packout?
What was the grade split?
How much fruit was rejected?
What were the main defect catergories?
How much downtime occurred?
Which shifts, varieties, growers, blocks, or batches performed better or worse?
This type of information is useful. It gives visibility. It allows team to look back and understand the result.
Here is another “But” - descriptive data has a limit.
It tells you what happened.
It does not always tell you why it happened.
And once you start looking at sorter performance seriously, “what happened” is usually not enough.
For example, it may be useful to know that pack-out was lower than expected.
But the more important question is:
“Why was the pack-out lower than expected?”
Was it crop condition?
Was it a grading decision?
Was it a machine setup issue?
Was it throughput pressure?
Was it inconsistent feeding?
Was it operator intervention?
Was it bin supply, labour, market specification, or a maintenance-related limitation?
That is where the next layer beings.
Example: Where Descriptive Reporting Starts to Become Diagnostic
A practical example of this is a throughput performance dashboard.
At one level, this kind of dashboard is descriptive. It shows what happened during the run. It can show how close the operation was to the throughput target, how much time was spent on target, how large the accumulated shortfall was, and where performance shifted during the run.
For example, a dashboard may show that the line was running for 61 minutes, spent 26 minutes on target, averaged running at 71% (tailored OEE throughput value) of the throughput target value, and accumulated a shortfall against the expected result (in this case individual fruit pieces, but could be lbs, cartons, etc.)
That information is useful because it gives the operation visibility.
But the more valuable step is when the dashboard begins to explain where the gap came from.
In this example, the dashboard doesnt just show that the operation missed target. It starts breaking the gap into contributiors, such as incoming fruit, recycle, and missed fruit. That begins to move the conversation away from:
“We were below target.”
and toward:
“What actually caused the gap?”
That is an important shift.
If the largest contributer was there wasnt enough fruit being fed to the machinem then the sorter itself may not have been the primary limitation. The issue may’ve been related to how the produce was being fed to the machine, the consistency of the infeed, upstream flow, bin presentation, operator control, or another process constraint before the fruit even reached the sizer.
If fruit that is assigned to be recycled is using up available carrier capacity, then the question changes again. Was recycle necessary because of production condition, grading setup, singulation issues, camera decisions, lane loading, or a processing choice that reduced useful throughput?
This is where reporting starts to become more useful.
The dashboard is no longer just showing the result. It is beginning to guide the investigation.
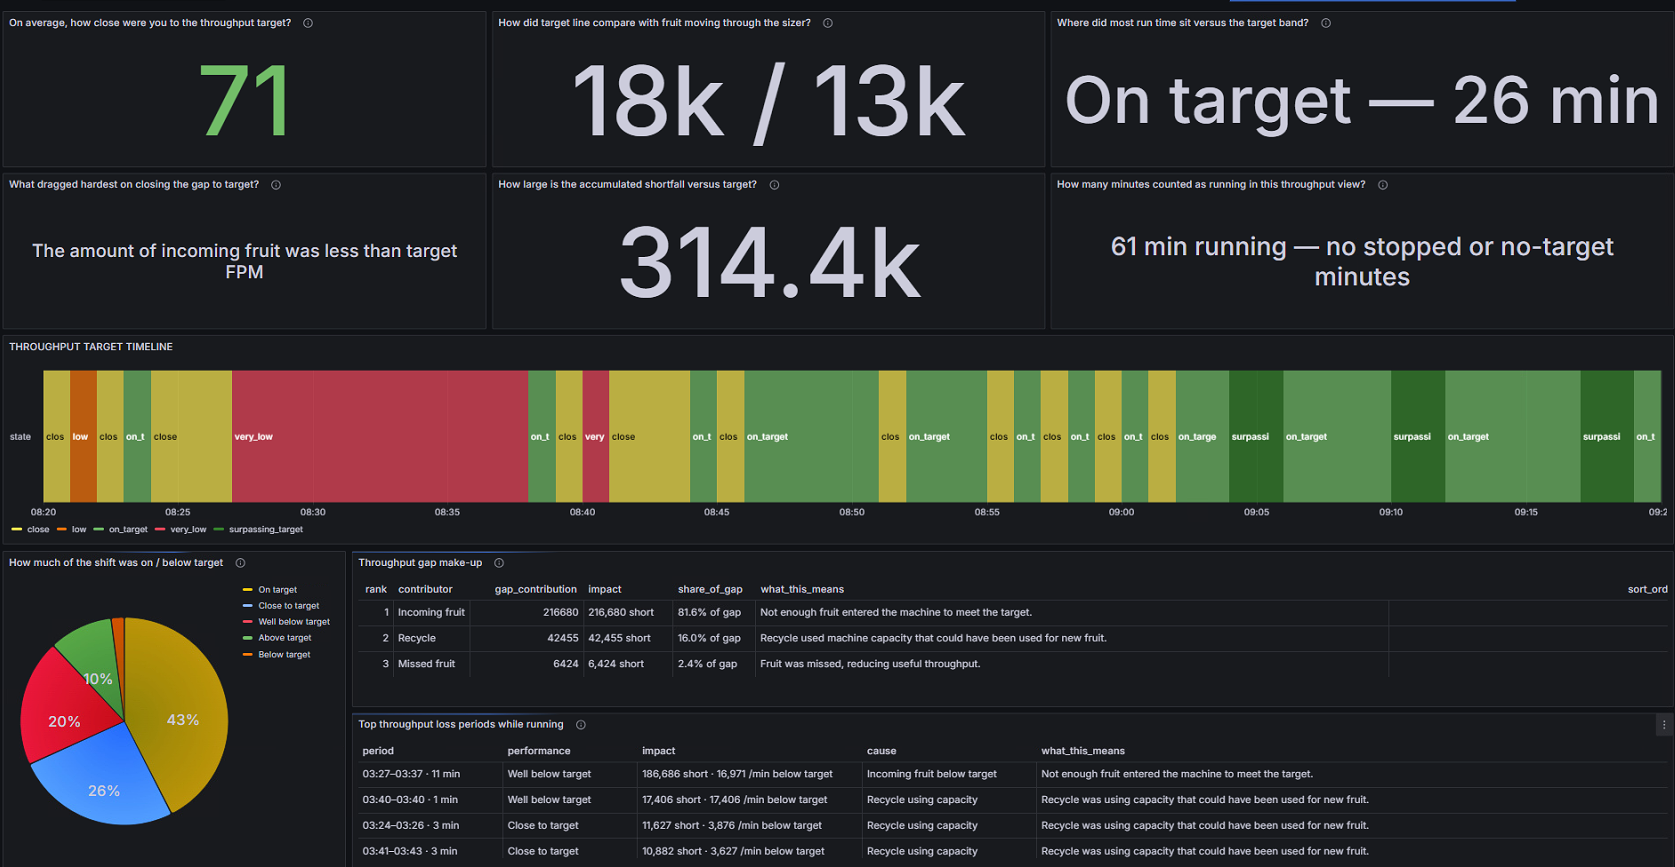
Figure 1. Example of a throughput performance dashboard used by OPTI-FRESH operators. This type of reporting starts with descriptive visibility, then begins to point the operation toward diagnostic questions about why the target was missed.
I think having people grok this layer will become increasingly important in the fruit and vegetable operations.
It is not yet full prescription. It does not automatically tell the operation what settings to run, what decision to make, or what will happen next time. That still requires real-world validation, operational context, and experience.
But it does create a stronger foundation for asking better questions.
And better questions are usually what lead to better decisions.
Level Three: Diagnostic Thinking — Why Did It Happen?
The diagnostic layer is where data starts to become much more valuable.
This is where you move from reporting results to investigating causes.
In my experience, this is where many operations have the biggest oppourtunity - specifically because the experience to perform this step in person and in realtime is rare skillset in our industry. If you’ve seen it in person you’ll understand what im talking about.
A packhouse may already have reports showing throughput, packout, defects, downtime, and grade splits. But the real value comes from connecting those numbers to the physical reality of the operation.
That means comparing machine data with what is happening on the floor.
It means asking better questions.
For example:
Why did the machine not process the volume we expected?
Was the sorter actually the limiting factor, or was the issue upstream or downstream?
Did the line run slower because the fruit was worse, or because the grading setup was more aggresive than necessary?
Did a change in settings improve the result, or did it just move the problem somewhere else?
This is where experience still matters.
Not because experience should replace data, but because operational experience helps you challenge data. It helps you notice when a number does not feel right. It helps you know where to look next.
Good diagnostic thinking is not about accepting whatever the system produces.
it is about testing the data against reality.
A useful dashboard may point toward the likely cause. But operation still needs to validate that cause against what physically happened,
Was fruit actually short at the infeed?
Was the line starved because of upstream flow?
Was the recycle figure correct?
Were the operators making changes that were not recorded?
Was the fruit condition different from what the data implied?
Was there a mechanical or process issue that the dashboard could not see?
That is the difference between having data and having understanding.
Level Four: Prescriptive Decisions — What Should We Do?
The next layer is prescriptive.
This is where the operation starts asking:
What settings, operating conditions, or decisions should we aim for?
This is an area where I think many businesses believe they are further ahead than they actually are.
It is common to assume that because a machine has recommended settings, historical reports, or experienced operators, the operation is already making prescriptive decisions.
But true prescriptive decision-making requires more than experience and more than machine output.
It requires validated data.
It requires comparison against real-world measurements.
It requires understanding the relationship between settings, fruit condition, throughput, packout, market requirements, and operational constraints.
Most importantly, it requires a feedback loop.
If you make a change, what actually happened?
Did the result improve?Was the improvement caused by the change, or by something else?
Can the result be repeated?Does the data match what was physically observed?
Would the same decision work with a different variety, grower line, defect profile, or market specification?
Without that validation, it is easy to fall into the trap of believing the numbers that support your existing bias.
That is a real risk.
In a high-pressure operating environment, people naturally look for evidence that supports what they already think. The danger is that data can make those assumptions look more credible than they really are.
This is why the ability to validate machine data against real operating conditions is becoming a job in itself.
And people with practical experience in this area are going to be in a very advantageous position as AI becomes more common in packhouse operations.
Level Five: Probabilistic and Predictive Thinking — What Is Likely to Happen?
The layer I am most interested in now is the step beyond prescription.
Not just:
“What should we do?”
But:
“What is likely to happen in the real world if we do this?”
That is a different level of thinking.
Fruit and vegetable sorting is not like manufacturing identical widgets. The product is variable. Conditions change. Crop profiles change. Defect pressure changes. Market requirements change. Operator behaviour changes. Mechanical condition changes.
So before operations become truly predictive, they may first need to become more probabilistic.
In other words:
If we run this variety at this speed, with this defect profile, under these grading conditions, what is the likely outcome?
If we adjust a threshold, what is the likely impact on packout, reject volume, rework, or market compliance?
If we increase throughput, where is the most likely constraint going to appear?
If we accept a lower or higher tolerance in one area, what trade-off are we likely to create somewhere else?
For OPTI-FRESH this is one of many areas of focus AI has potential.
But AI will only be useful if the foundation underneath it is strong.
If the data is incomplete, poor;y understood, or not validated against the real world, then AI will not magically solve the problem. It may simply make poor assumptions faster.
The operations that benefit most from AI will not be the ones that simply have the most data.
They will be the ones that have the most trusted data, the clearest operating context, and the strongest feedback loops between machine output and real-world results.
The Future of Sorter Performance Is Not Just Technical
When people think about improving sorter performance, they often think about mechanical upgrades, software features, camera systems, defect detection, or automation.
All of those things matter.
But the next major leap in performance will also come from better operating systems.
Not just the software inside the machine, but the decision-making system around the machine.
How do you measure performance?
How do you know what good looks like?
How do you identify lost potential?How do you separate machine limitation from operational limitation?
How do you validate the data?
How do you turn information into better decisions?
How do you make those decisions repeatable across shifts, seasons, products, and teams?
These are the questions OPTI-FRESH is focused on.
Because in many operations, the opportunity is not just in the machine itself.
The opportunity is in how the machine is assessed, understood, operated, and improved over time.
Where OPTI-FRESH Fits
The original question still matters:
Is your fruit sorter hitting its true potential?
But the way I think about that question has evolved.
Today, I see sorter performance as a maturity journey.
First, you need reliable measurement.
Then you need descriptive reporting.
Then you need diagnostic understanding.
Then you need prescriptive decision-making.
Then, eventually, you can move toward probabilistic and predictive operation.
That is the direction I see the industry heading.
And that is the direction OPTI-FRESH is moving in as well.
The goal is to take the thought processes, checks, frameworks, and systems I have developed through hands-on experience and make them available in a practical way for more operations.
Because the future of automated fruit and vegetable sorting will not only belong to the businesses with the best machines.
It will belong to the businesses that know how to measure, understand, and continuously improve the way those machines are used.
Disclaimer: The views shared in this article are my own. They are not intended as a universal rulebook, but as a practical perspective based on my experience working with automated fruit and vegetable sorting operations.